Decoding lineup rotation cycles that shift point spread values in midseason NBA back-to-back road contests
Written by Jordan Schmid · Aug 16, 2026
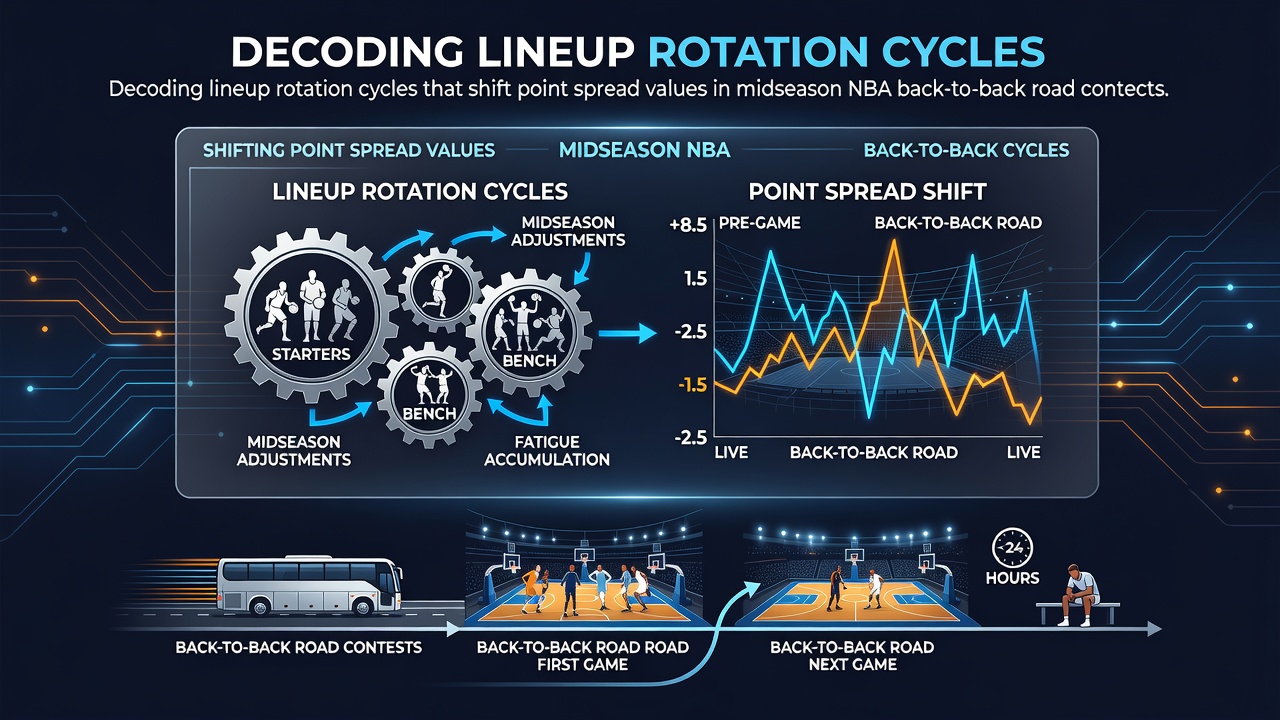
Decoding lineup rotation cycles that shift point spread values in midseason NBA back-to-back road contests
Lineup rotation cycles in the NBA create measurable shifts in team performance during midseason back-to-back road contests, and betting markets adjust point spreads accordingly. Teams face increased travel demands and recovery challenges once the schedule intensifies after the holiday period, which leads coaches to alter starting units and minute distributions. Data from multiple seasons shows that these adjustments often produce different scoring outputs and defensive efficiencies compared to standard single-game road trips.
Patterns in midseason scheduling and travel demands
Midseason stretches typically begin around January and extend through March, when the league packs multiple back-to-back sets into short windows. Road contests compound the issue because teams must fly between cities with limited rest, and league tracking systems record average travel distances exceeding 2,000 miles per week for affected clubs. Observers note that rotation decisions accelerate once teams reach the 40-game mark, because cumulative fatigue registers in player tracking metrics such as distance covered and high-intensity minutes.
Coaching staffs review internal load management reports before these stretches and often reduce minutes for players who logged heavy usage in the prior month. The result appears in box scores as lower field goal percentages and reduced assist rates for primary creators, which in turn influences how oddsmakers set opening lines for the second game of a back-to-back.
How rotation cycles alter expected outcomes
Teams implement rotation cycles that include both starter reductions and bench expansions during the second half of back-to-back road games. Research from sports analytics groups indicates that starting lineups change in roughly 65 percent of such contests after the All-Star break, with point guards and wings seeing the largest minute drops. These shifts correlate with a decline in offensive rating of 4 to 6 points per 100 possessions when compared to the first game of the set.
Point spread values move in response because sportsbooks incorporate projected lineups released 90 minutes before tip-off. When a star player’s usage rate falls below season averages, the expected margin narrows or widens depending on the opponent’s defensive profile. Historical figures reveal that spreads adjust by an average of 1.5 to 2.5 points in the final hours before tip when rotation news emerges.
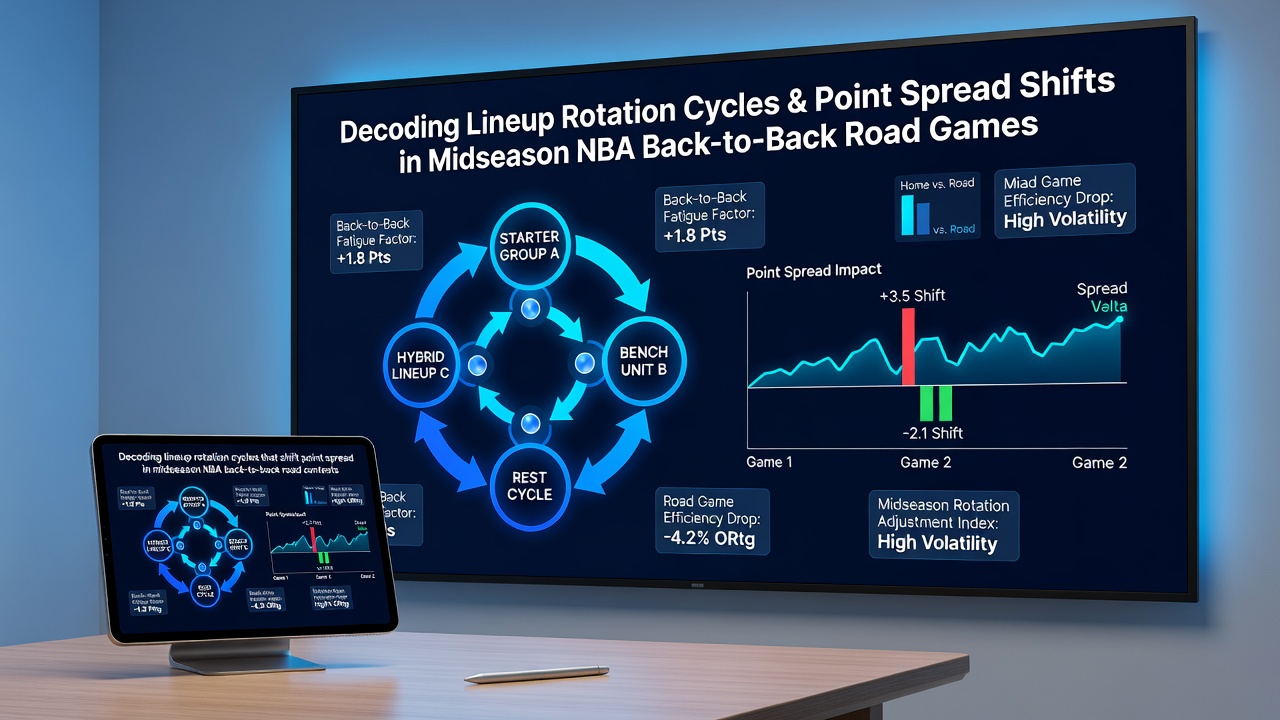
Data correlations between rest allocation and spread movement
Advanced tracking platforms capture rest allocation through load management dashboards that teams share with league offices. Studies compiled by university sports science departments show that teams resting two or more rotation players in the second game of a back-to-back see their implied point totals drop by 3 to 5 points. These changes register quickly in betting markets, where sharp money often targets the adjusted spread once official injury reports confirm the rotations.
August 2026 schedule releases already highlight several clusters of back-to-back road games for Western Conference clubs, and early projections suggest similar rotation patterns will emerge once the 2026-27 season reaches its midpoint. Analysts track these cycles by comparing usage rates across the first and second games, noting consistent drops in three-point attempt volume when travel exceeds standard thresholds.
League-wide examples and statistical benchmarks
One pattern documented across recent seasons involves Eastern Conference teams traveling to the West Coast for consecutive games. In these scenarios, coaches frequently expand bench minutes for bigs who handle rebounding duties, which produces measurable changes in second-chance points allowed. Spreads reflect the shift because oddsmakers model the reduced efficiency of the primary frontcourt unit.
Another recurring cycle occurs when teams play four games in five nights. Data indicates that the third and fourth games feature the most aggressive rotations, with point spreads moving an average of 2 points toward the rested opponent. External benchmarks from NBA advanced stats confirm that defensive rebounding rates decline when rotation depth is tested over consecutive nights.
International research from Canadian sports performance institutes further links sleep displacement metrics to these outcomes, showing that transcontinental flights amplify the need for minute reductions. The resulting performance gaps appear in both totals and spreads, with markets tightening around the adjusted team totals once lineups stabilize.
Conclusion
Rotation cycles in midseason back-to-back road contests generate predictable changes in team output that directly influence point spread values. Tracking these patterns through usage data, travel logs, and injury reports allows observers to follow how markets recalibrate expectations game by game. Continued collection of advanced metrics across upcoming seasons will refine understanding of the precise thresholds at which spreads shift most significantly.