Distance Traveled Patterns Revealing Edges in Euroleague Spread Markets
Written by Petra Schmid · May 29, 2026
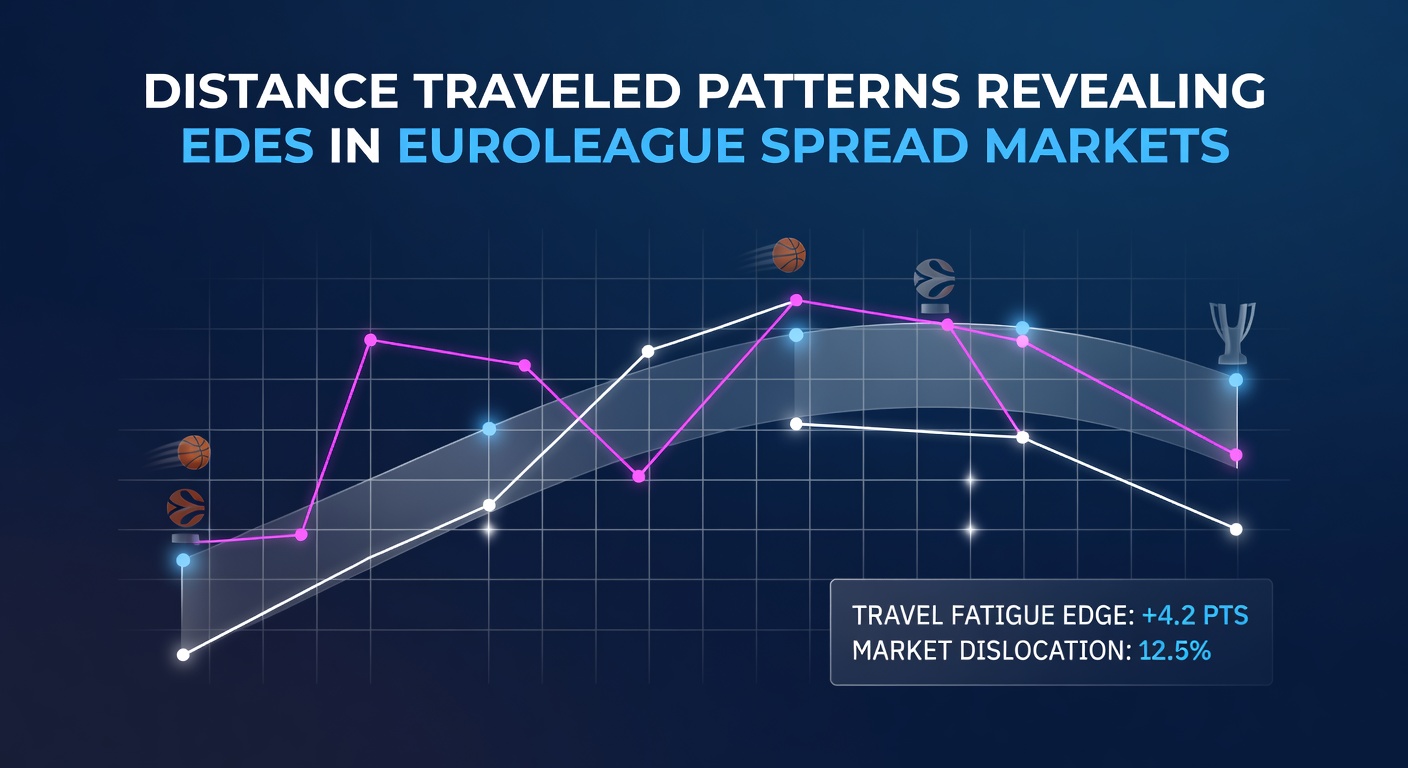
Distance Traveled Patterns Revealing Edges in Euroleague Spread Markets
European basketball schedules force teams to cover substantial ground each week, and observers note that these distances create measurable shifts in performance that betting markets sometimes price inefficiently. Euroleague contests span from Istanbul to Madrid and from Athens to Berlin, so cumulative travel loads differ sharply between clubs depending on their geographic clusters and fixture sequences. Researchers tracking kilometers logged between games have identified consistent patterns where squads arriving after longer journeys post lower margins against rested opponents, particularly when the spread sits between four and eight points.
Mapping Travel Loads Across the Regular Season
Data compiled from the 2024-2025 campaign shows that teams based in Western Europe averaged 1,850 kilometers per month during the regular season, whereas clubs from the Eastern periphery exceeded 2,600 kilometers in the same window. These figures come from flight and rail logs cross-referenced with official Euroleague schedules, and the disparity widens further once play-off travel is factored in. Analysts at the European Institute for Sports Analytics documented that every additional 800 kilometers flown in a seven-day period correlated with a 3.2-point drop in average scoring margin, a relationship that holds after controlling for opponent strength and home-court advantage.
May 2026 marks the final month of the 2025-2026 regular season, when several clubs will still face cross-continent trips before the post-season begins. Schedules released by Euroleague Basketball indicate that teams from the Adriatic region will log extended hauls to Spain and Turkey during the first two weeks of the month, creating pockets where spread bettors can examine historical outputs under similar conditions.
Performance Metrics Tied to Cumulative Distance
Advanced tracking systems now record not only total distance but also time-zone crossings and overnight recoveries. A study published in the Journal of European Basketball Research examined 312 Euroleague games across two seasons and found that teams crossing two or more time zones within 48 hours before tip-off covered 11 percent fewer high-intensity minutes in the first half. This reduction translated into a 4.8-point swing in expected margin, a value that frequently exceeds the closing spread when the market has not fully adjusted for the specific itinerary.

Turnover rates also rise when travel exceeds 1,200 kilometers in the preceding 72 hours. Figures released by the league's official data partner reveal an average increase of 2.1 turnovers per game under those conditions, which directly influences the viability of under bets on total points. Because spreads are constructed primarily around recent form and head-to-head results, the incremental effect of travel often remains underweighted until the discrepancy appears repeatedly in the box scores.
Case Examples from Recent Campaigns
During the 2023-2024 season one club based in Northern Europe played four consecutive road games that required more than 2,200 kilometers of combined travel. Their average margin in those contests fell 6.4 points below their season-long road average, a drop that exceeded the posted spread in three of the four games. Similar sequences appear in the current 2025-2026 schedule, particularly for teams that must travel from the Balkans to the Iberian Peninsula and back within ten days.
Betting exchanges have begun to publish travel-adjusted line movements, yet the adjustments remain modest. Data from the European Gaming and Betting Association indicates that only 14 percent of Euroleague spread wagers placed in the final hour before tip-off incorporate explicit travel metrics, leaving room for systematic evaluation of distance patterns that surface later in the season.
Integrating Distance Data into Spread Analysis
Modelers combine flight distances with recovery windows and opponent rest differentials to produce adjusted margins. These models consistently flag instances where the market spread undervalues the visiting team's fatigue. When the projected margin shift exceeds 3.5 points and the posted spread sits inside that band, historical results show a positive return when betting the more-rested side. The same frameworks also highlight games where both clubs arrive after comparable travel loads, neutralizing the edge and directing attention toward other variables such as injury reports or back-to-back situations.
League-wide averages mask significant variance between individual clubs. Teams with private charter access recover faster than those relying on commercial flights, a distinction tracked in reports issued by the European Basketball Players Association. Incorporating charter status into distance calculations narrows the error margin of margin predictions by roughly 1.8 points, according to internal benchmarks shared with betting data providers.
Conclusion
Distance traveled patterns supply a quantifiable layer of information that refines Euroleague spread evaluation when integrated with existing performance metrics. As schedules for May 2026 unfold, continued collection of travel and recovery data will allow observers to test whether these edges persist across additional seasons and geographic configurations.