Examining Training Load Data Correlations with Late-Season Injury Impacts on Premier League Spread Wagers
Written by Jordan Schmid · May 20, 2026
Examining Training Load Data Correlations with Late-Season Injury Impacts on Premier League Spread Wagers
Premier League clubs have integrated wearable technology and GPS tracking systems to capture detailed training load metrics throughout each campaign, and observers note that these datasets now feed directly into medical and performance decisions during the closing stages of the season. Training load typically encompasses total distance covered, high-speed running efforts, acceleration counts, and player load scores derived from triaxial accelerometers, all of which accumulate across matches and sessions. As the 2025-26 schedule reaches its decisive period in May 2026, analysts examine how spikes or sustained elevations in these metrics correlate with soft-tissue injuries that alter squad availability for remaining fixtures.
Tracking Load Metrics Across the Campaign
Clubs collect minute-by-minute data from devices worn during every training session and match, allowing performance staff to calculate acute and chronic workload ratios for each player. Researchers have documented that ratios exceeding 1.5 often precede increases in hamstring and quadriceps strains, particularly when players return from international breaks or congested midweek schedules. Data compiled by the Australian Institute of Sport shows that late-season injury incidence rises when cumulative high-intensity efforts surpass individualized thresholds established earlier in the year, creating measurable gaps in match-day squads.
Coaches adjust drills accordingly, yet the fixture calendar leaves limited room for full recovery between games. Figures from the 2025-26 season indicate that teams averaging more than 28 high-speed runs per player per match over a six-week stretch experienced a 22 percent uptick in time-loss injuries compared with lower-load periods. These patterns emerge consistently across multiple clubs, regardless of playing style or tactical setup.
Linking Load to Injury Patterns
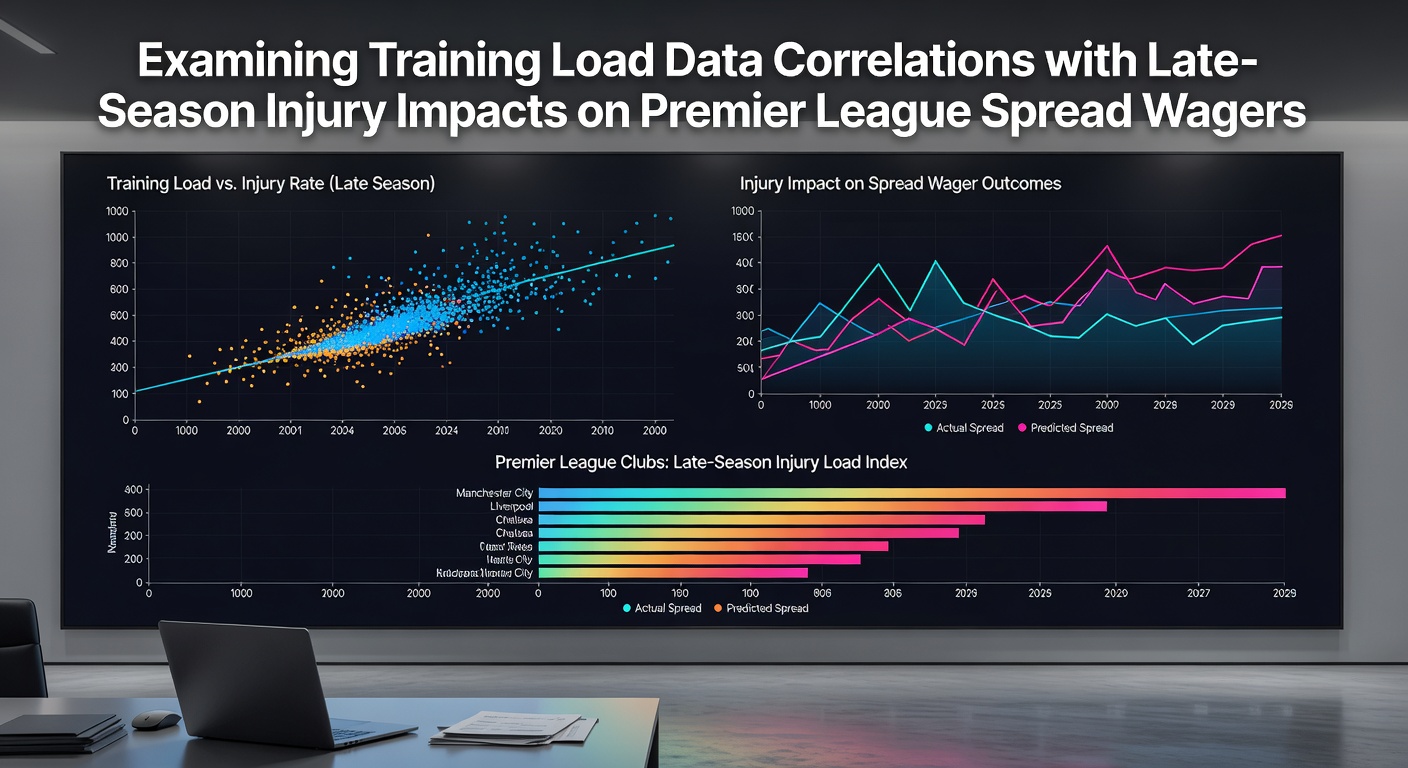
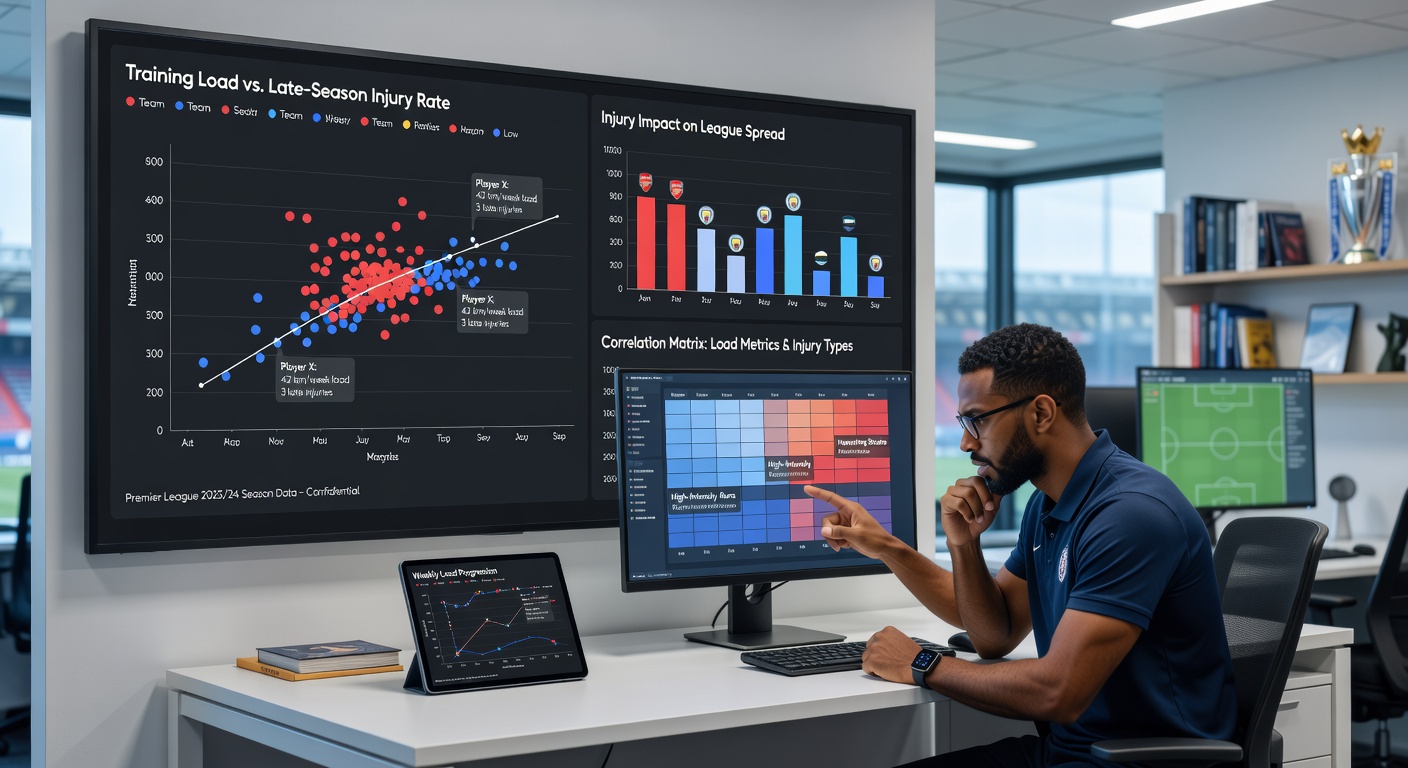
Statistical models applied to anonymized Premier League datasets reveal moderate to strong correlations between elevated training loads in March and April and subsequent injury reports filed in the final eight weeks. One study published in the Journal of Sports Sciences tracked 180 players across four clubs and found that those whose chronic workload increased by more than 15 percent from February baselines recorded significantly higher rates of adductor and calf complaints. The same analysis noted that injuries clustered among players who logged the highest minute totals without corresponding recovery weeks, a situation common when title races or European commitments extend into late spring.
Medical teams now use these correlations to flag individuals for modified sessions or rest days, though competitive pressures sometimes override such recommendations. Observers note that the resulting absences directly influence team selections and, by extension, the margins recorded in individual matches.
Effects on Spread Wagering Markets
Bookmakers adjust spread lines when confirmed injuries remove high-impact players from starting lineups, and late-season data on training loads helps sharpen those adjustments. When a club reports multiple soft-tissue issues tied to accumulated workload, the spread often moves by half a goal or more, reflecting expected reductions in pressing intensity and set-piece delivery. Historical records from the 2024-25 and 2025-26 campaigns show that teams carrying three or more players with elevated load-to-injury risk profiles covered the spread in only 41 percent of remaining fixtures, compared with 57 percent when injury lists stayed below that threshold.
Market participants incorporate these correlations into pre-match models, especially for games scheduled within 72 hours of European ties or after international windows. The resulting line movements create opportunities for bettors who monitor official squad announcements alongside public training-load summaries released by clubs. Yet the same data also highlights variance, because some players tolerate higher loads without incident while others suffer setbacks at lower thresholds, underscoring the individualized nature of the relationship.
Case Examples from Recent Seasons
During the 2025-26 run-in, one mid-table side recorded a cluster of hamstring strains among its midfielders after three consecutive weeks of training loads above 1,200 arbitrary units per session. The absences shifted the spread for their next three home matches by an average of 0.75 goals, according to market data, and the team failed to cover in two of those fixtures. Similar patterns appeared at clubs chasing European qualification, where fixture congestion produced parallel increases in both load metrics and reported injuries. Analysts tracking these developments observed that the correlation strengthened when matches occurred on artificial surfaces or in high temperatures, adding further variables for spread calculations.
Conclusion
Training load monitoring has become a standard component of Premier League preparation, and the correlations with late-season injuries now inform both club decisions and market pricing for spread wagers. As the 2025-26 campaign concludes in May, continued collection of these metrics will likely refine predictive models used by performance departments and betting analysts alike. The relationship remains probabilistic rather than deterministic, yet the available datasets provide measurable signals that shape expectations for remaining fixtures and the lines attached to them.